Overview
When generating high quality LC-MS/MS data there are many pitfalls resulting in unusable data. Recognizing and stopping a poor performing analysis is critical to preserve specimen integrity and maximizing instrument up-time.
Controlling untargeted data acquisition is multifaceted and often tailored to a specific analytical method or matrices. Quality control measures should be implemented for every analysis and specimen. These measures include the use of both internal standards - exogenous compounds added to each specimen - and biological standards to quantify instrument performance prior to and throughout an analysis. However, analyzing the resulting data from these controls can be tedious and time-consuming.
This section describes the various features of Rapid-QC-MS, and how they can help monitor the quality of your untargeted LC-MS/MS data in a time-efficient manner.
Interactive dashboard
Rapid-QC-MS employs Plotly to serve synchronous, interactive graphs in the user dashboard. These plots display m/z, RT, and intensity results for each internal standard. Rapid-QC-MS automatically parses newly generated raw data files and updates the dashboard in real time throughout an analysis – effectively freeing up valuable time and resources for much more efficient QC.
Retention time across specimens
Plotting retention time values for a given internal standard alerts users to retention time shifts, which can indicate any of the following:
- Incorrect mobile phase composition
- Solvent leaks in the flow path
- Changes in column temperature
- Faulty / blocked column
The retention time vs. specimen plot provides an at-a-glance view into trends or issues with chromatography. The user can hover over each point to display relevant metadata for a specimen, zoom or pan over the graph, and even grab a screenshot for easy sharing with teammates.
Try it out yourself below!
Additionally, the user can select an internal standard using the dropdown, or seek through them using the previous / next buttons. Rapid-QC-MS provides global filters for polarity and specimen type in the sidebar as well.
Intensity across specimens
Plotting intensity (peak height) values can give insight into specimen preparation and ionization variability. Low internal standard intensities could indicate:
- Misinjection
- Error in specimen preparation
- Unstable instrument performance
Rapid-QC-MS allows you to filter the intensity vs. specimen plot by specimens, pools, or blanks using the plot filter in the sidebar. You can also scroll through the plot using the plot scroll bar at the bottom.
Delta m/z across specimens
Mass accuracy throughout an analysis can be evaluated by plotting Δm/z values, which also provides insight into the instrument’s overall performance.
Incremental changes or trends in drifting mass accuracy are not always apparent. By reviewing Δm/z vs specimens the user can detect and address degrading mass accuracy before it compromises the integrity of their experiment.
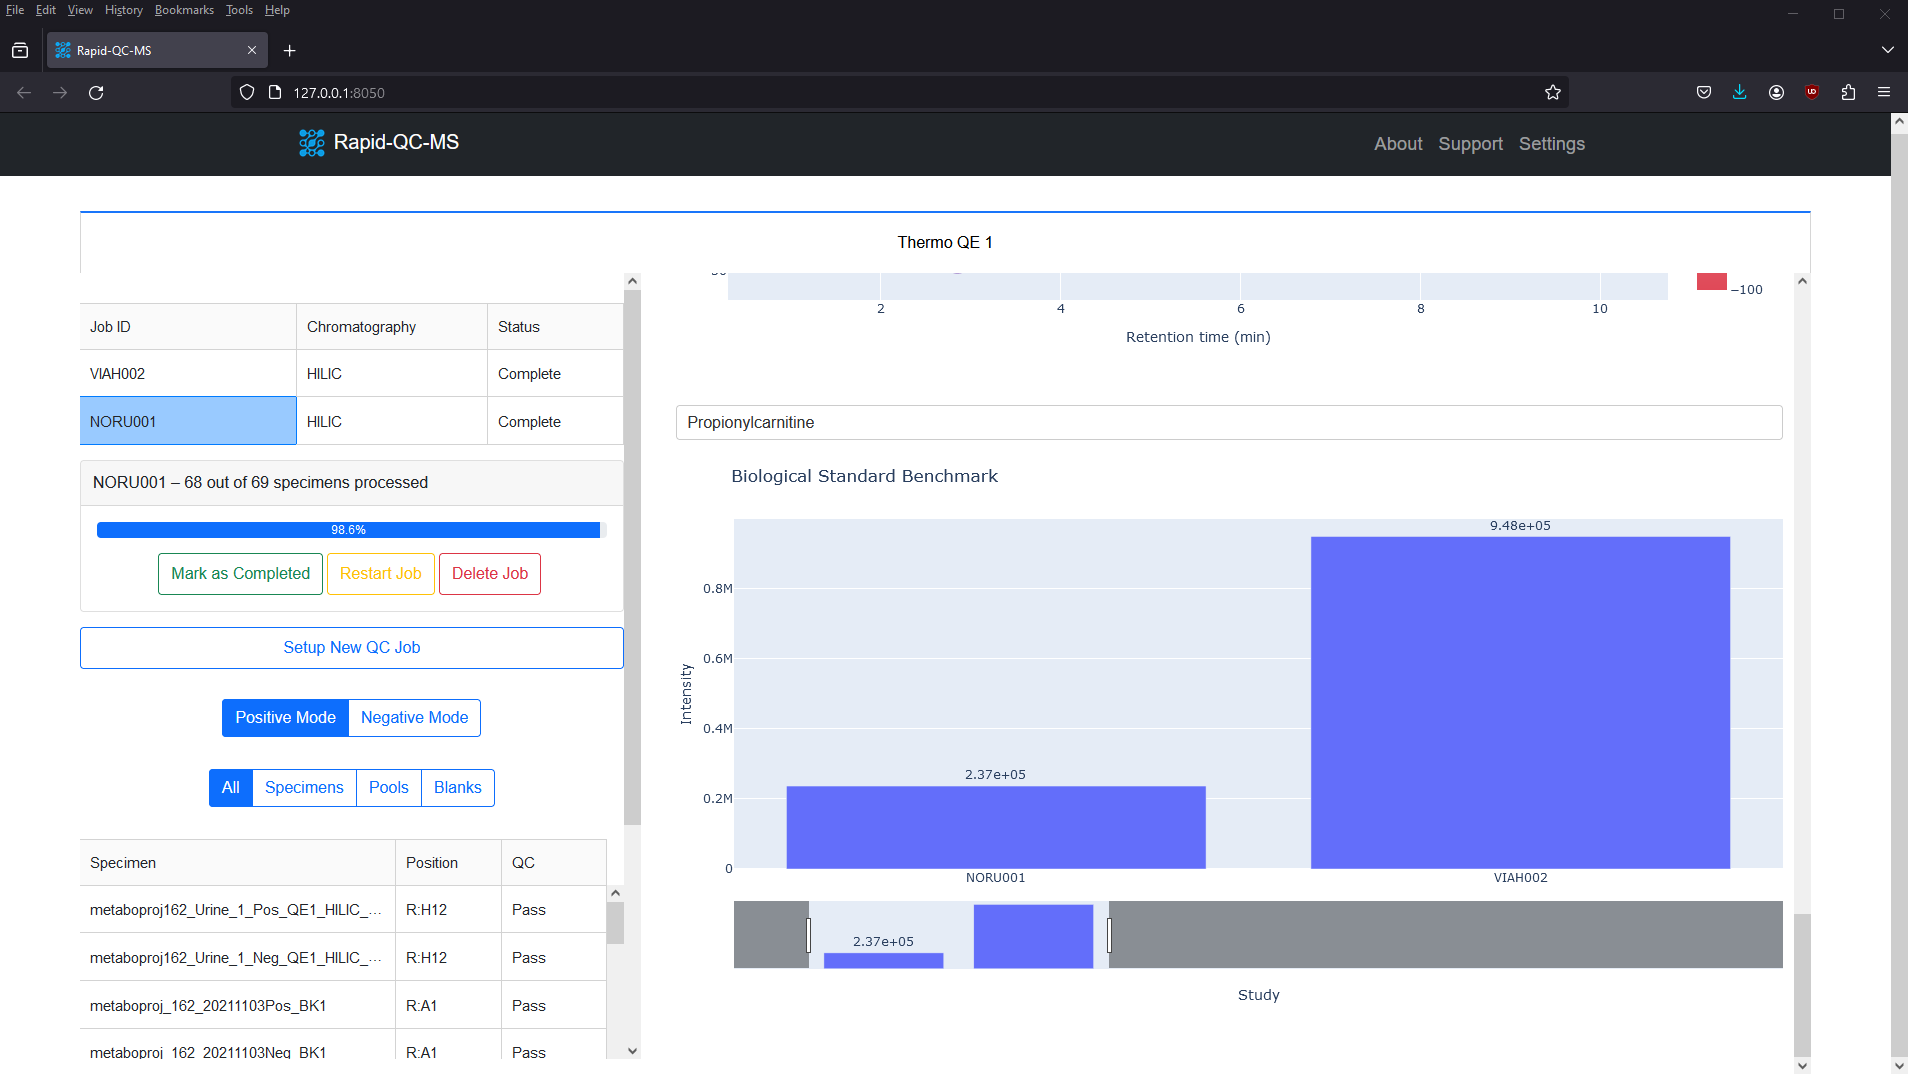
Biological standards
Rapid-QC-MS allows users to apply biological standards in two ways: 1) Use a reference standard to compare current instrument performance to previous analyses. 2) Use the external standards module to repeatedly analyze the same specimen over the course of an analysis.
The m/z vs RT plot provides an at-a-glance view of all desired features. This plot can be used to recognize trends in instrument performance across all features or to evaluate the fitness of specific features.
The plot features a colorscale for the percent change of each feature (for a selected biological standard) from its average intensity.
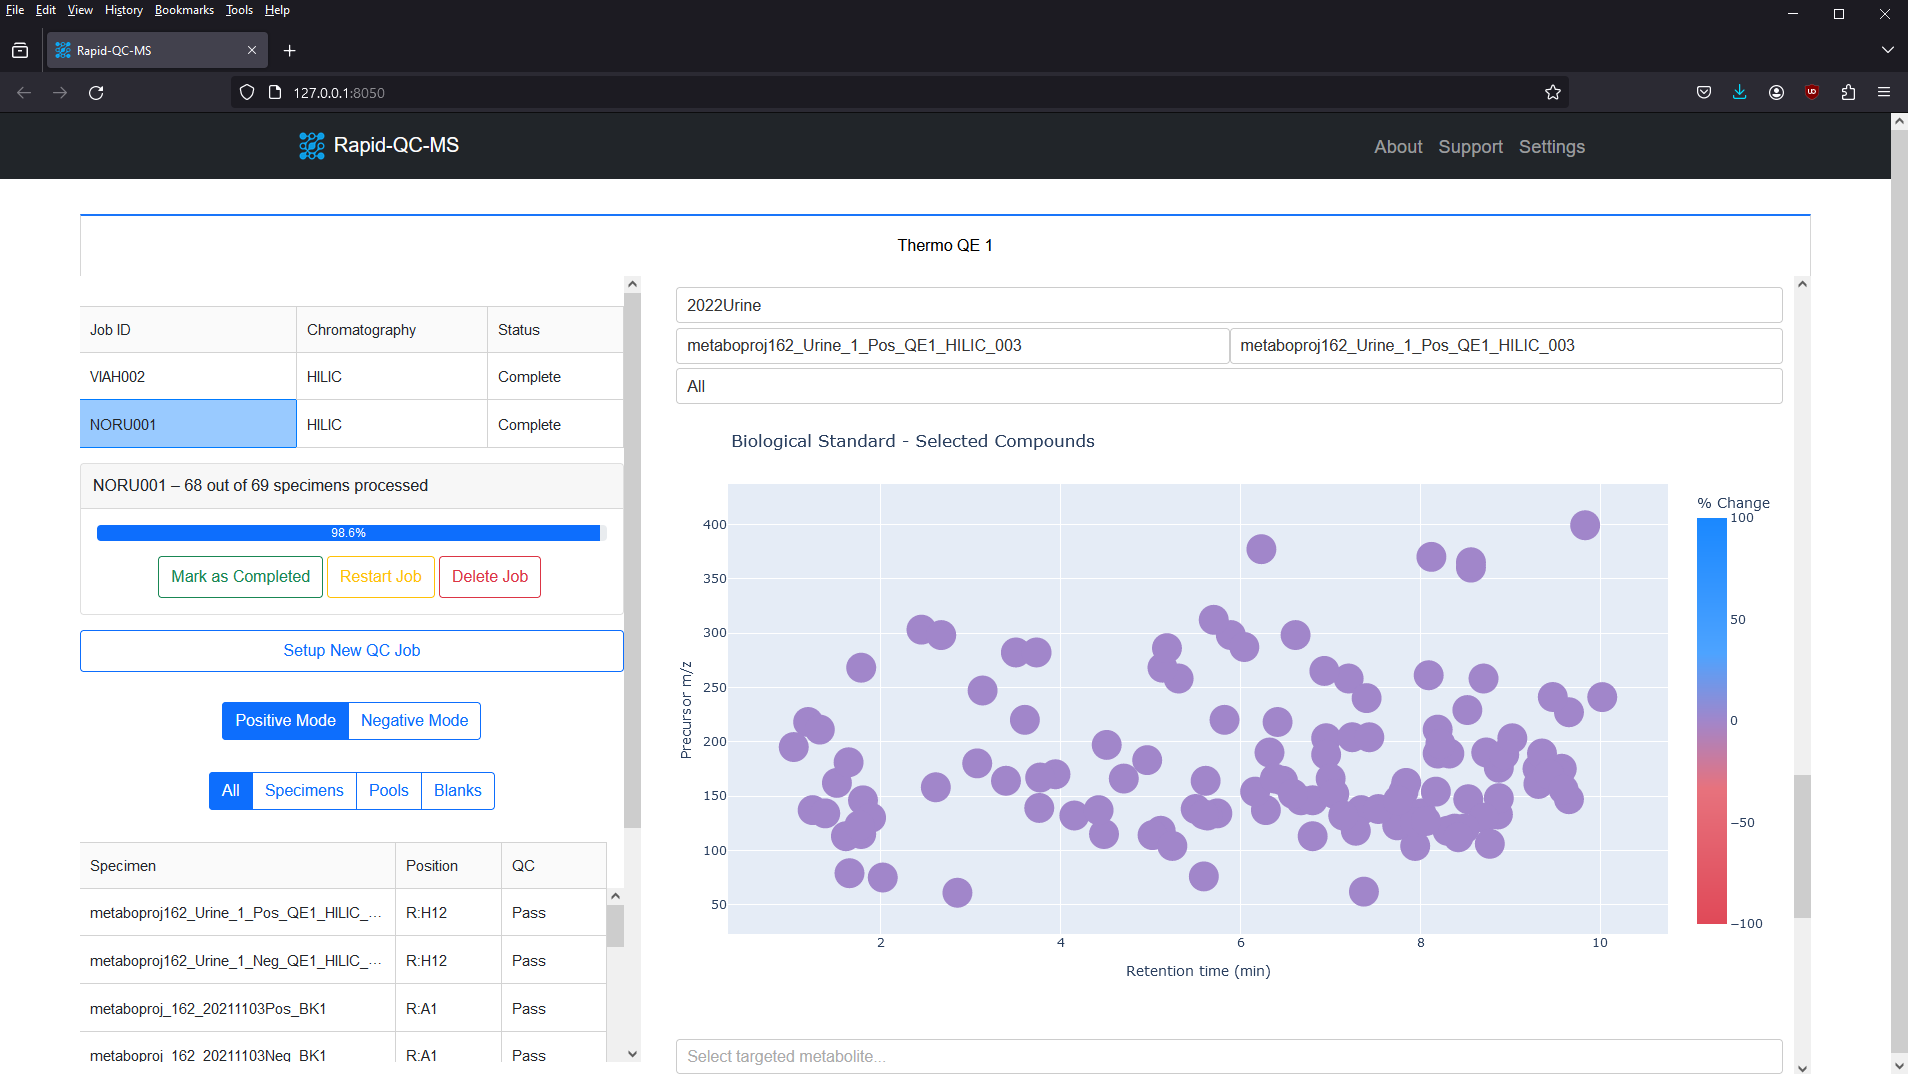
Blue represents positive percent change and red represents negative percent change, meaning you can breathe easy for plots with lots of blue, or start investigating if you see lots of red.
Clicking any of the features updates the feature intensity across instrument runs plot, which provides a firsthand view of whether your instrument’s performance has declined or improved over time.
Setting up biological standards is easy. You can add targeted feature libraries for biological standards in different chromatography methods and polarities in Settings > Biological Standards. Visit the User Guide to see how.
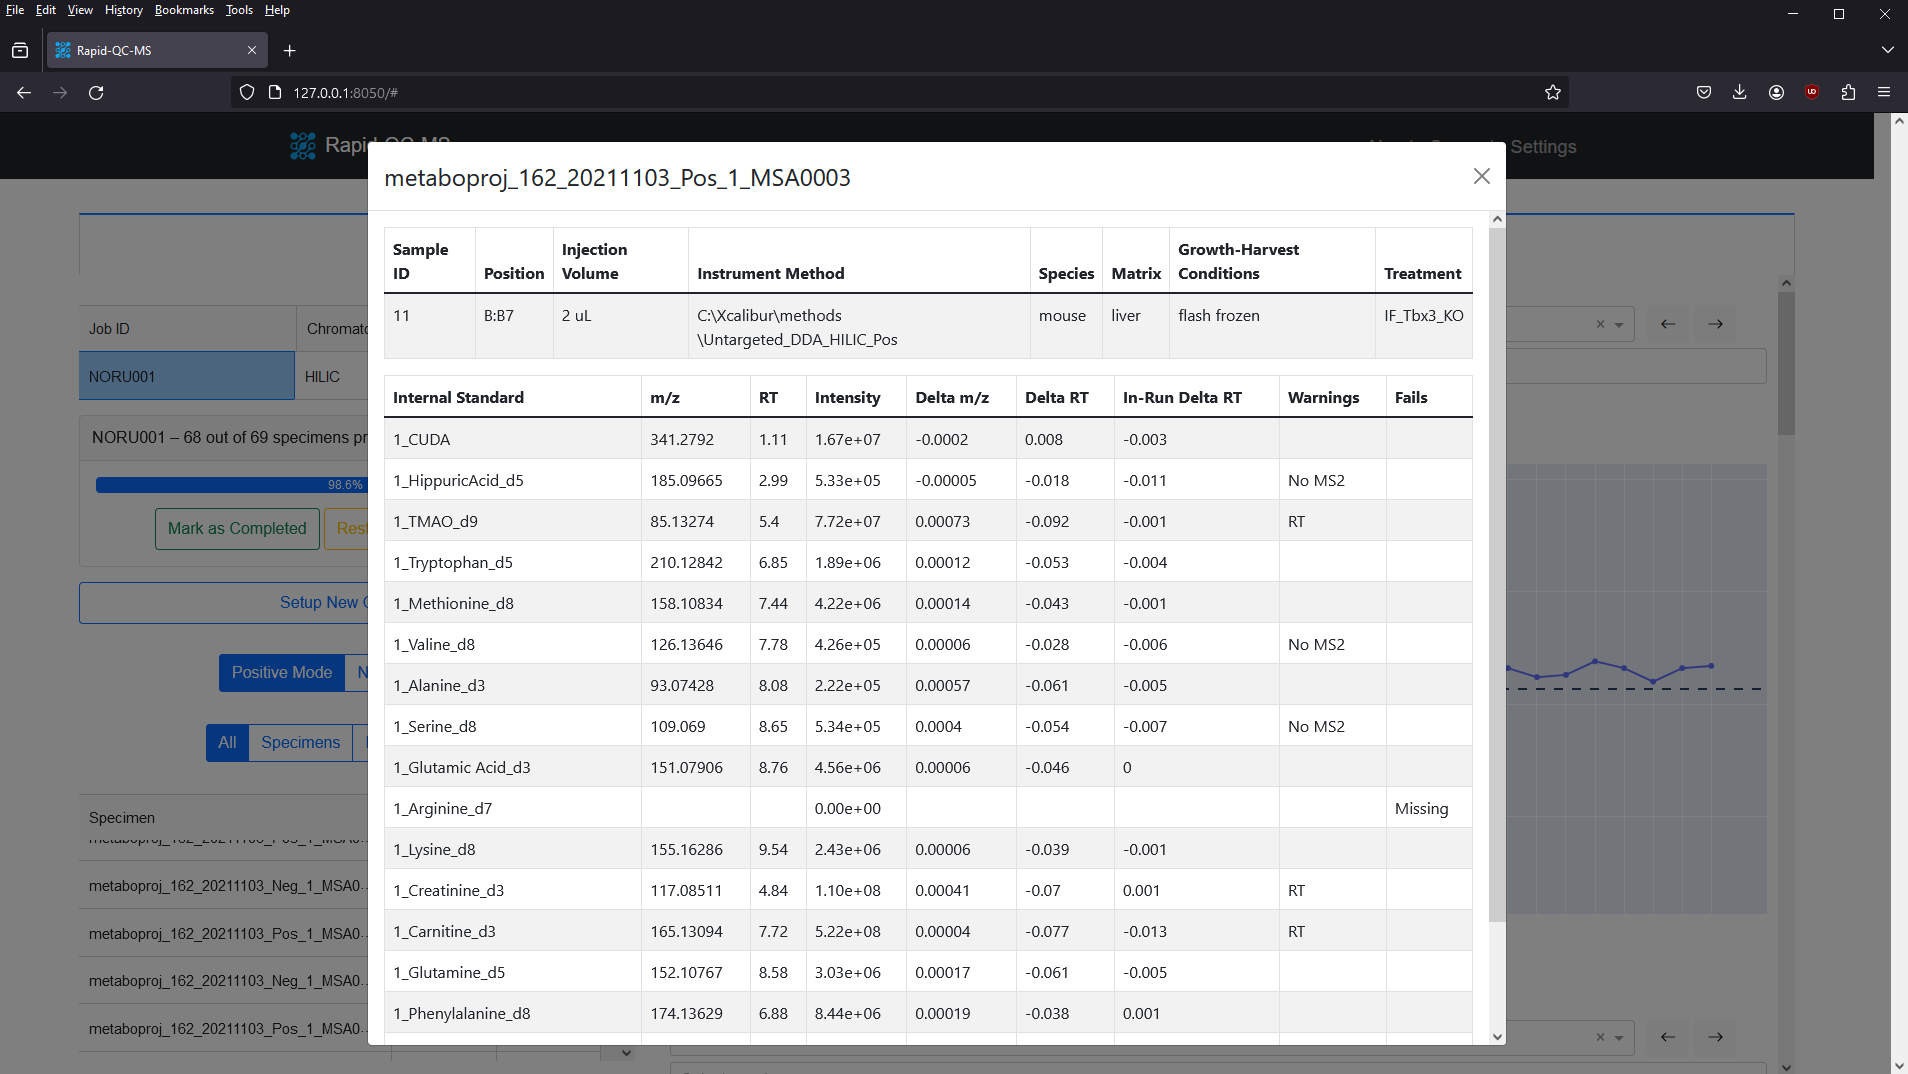
Specimen information card
To investigate a specimen more closely, you can select one from the specimen table (or click a marker on the plot!) and the specimen information card will open.
This card conveniently aggregates specimen information from the acquisition sequence, specimen metadata, processed data, and QC results in one place.
New QC job setup
QC jobs point Rapid-QC-MS to monitor active instrument runs or process data files in bulk. Setting up a new job was designed to be as fast and easy as possible.
To QC a current analysis or previously acquired data files, the user can click the ‘Setup New QC Job’ button on the dashboard and enter:
- Job ID: a unique name for this set of specimens
- Chromatography: the chromatography method for a given analysis
- Biological standard(s) (optional): any biological standards included in the analysis
- Acquisition sequence file: the acquisition sequence, in CSV format
- Specimen metadata file (optional): metadata for specimens, in CSV format
- Data file directory: the folder in which data files will be acquired (or will exist)
The form then validates resources and gives the user intelligent feedback.
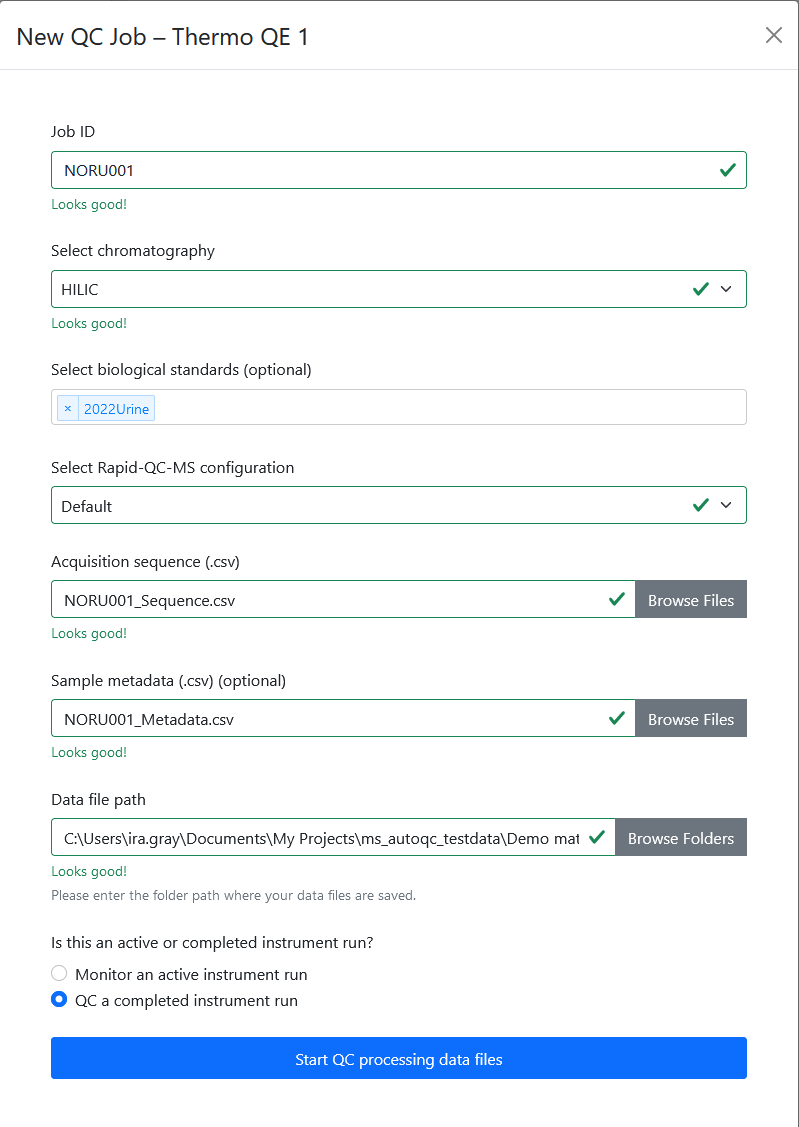
Once the user has chosen whether the job is for an active or completed instrument run, the new job can be executed.
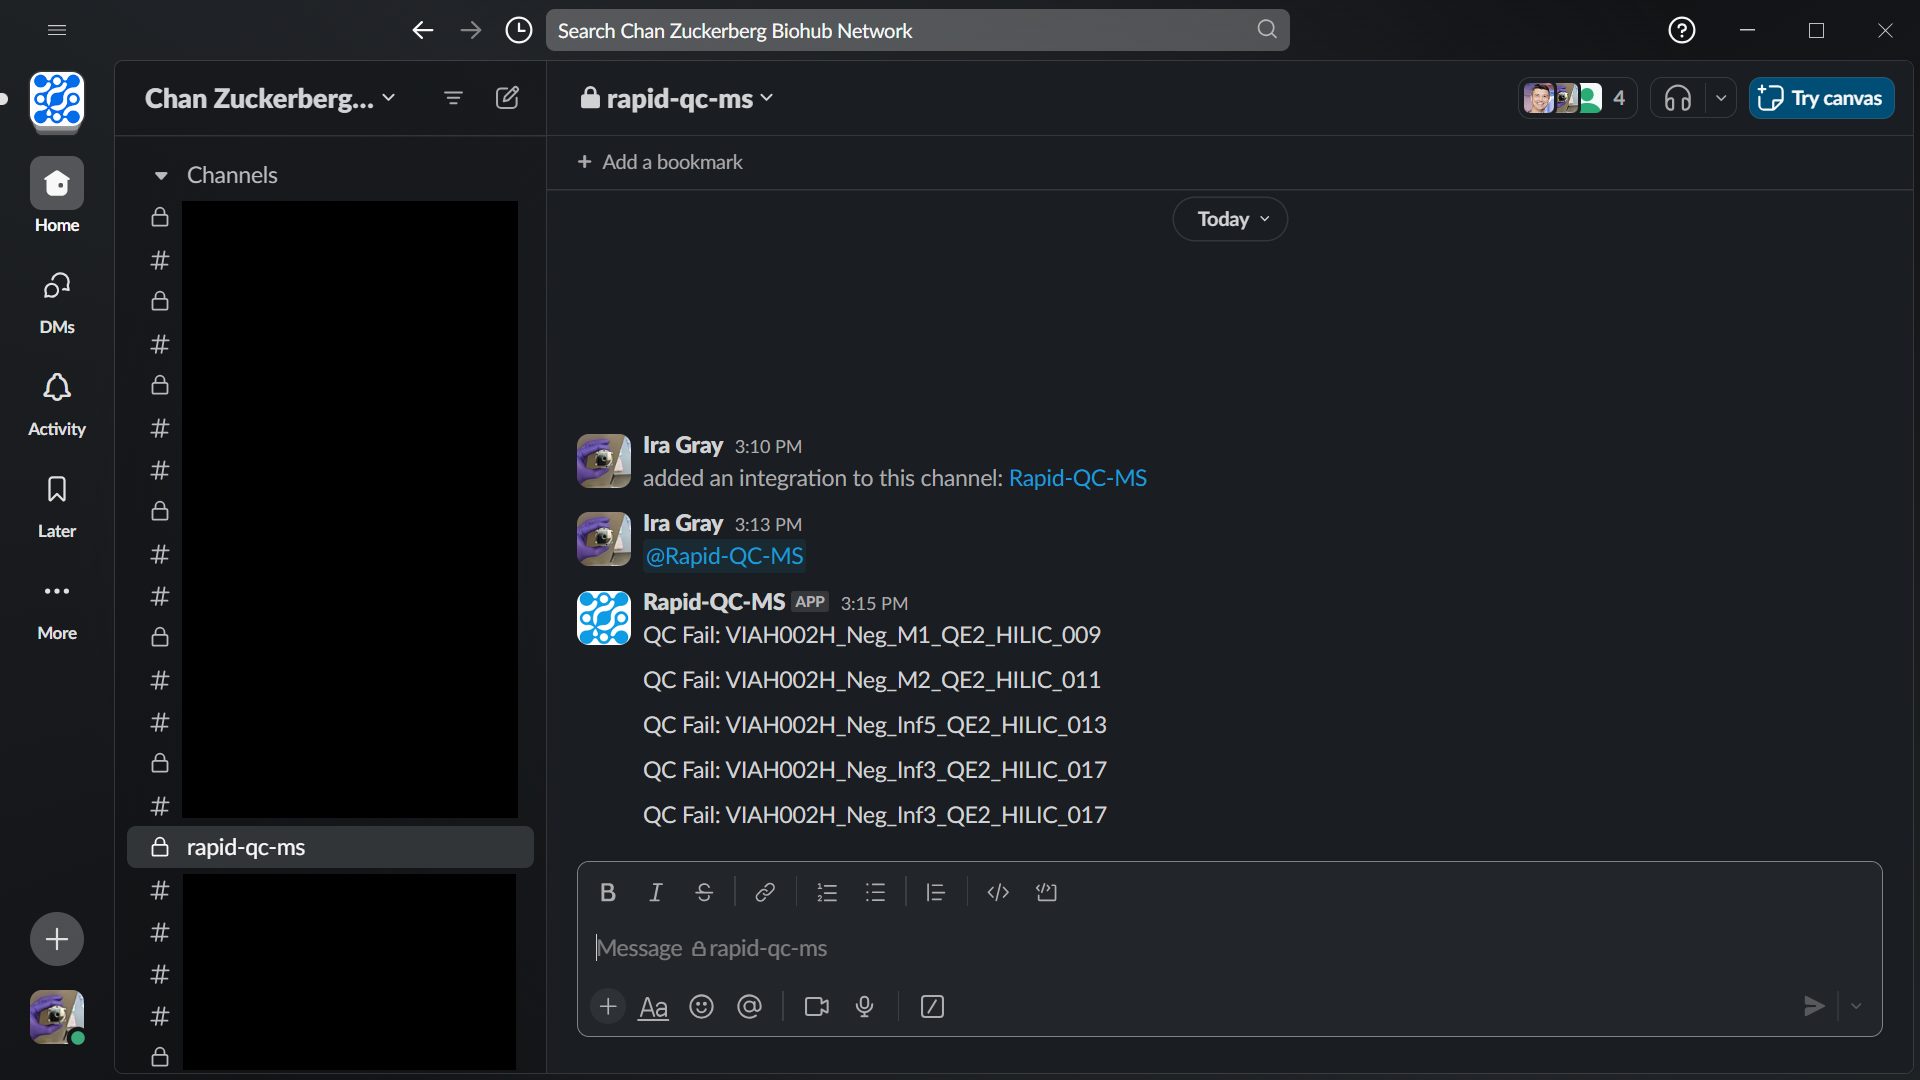
Slack / email notifications
Be in the know without sitting in front of your instrument. Get live notifications during active instrument runs – via Slack or email – so that you can deal with QC warnings and fails in a timely fashion.
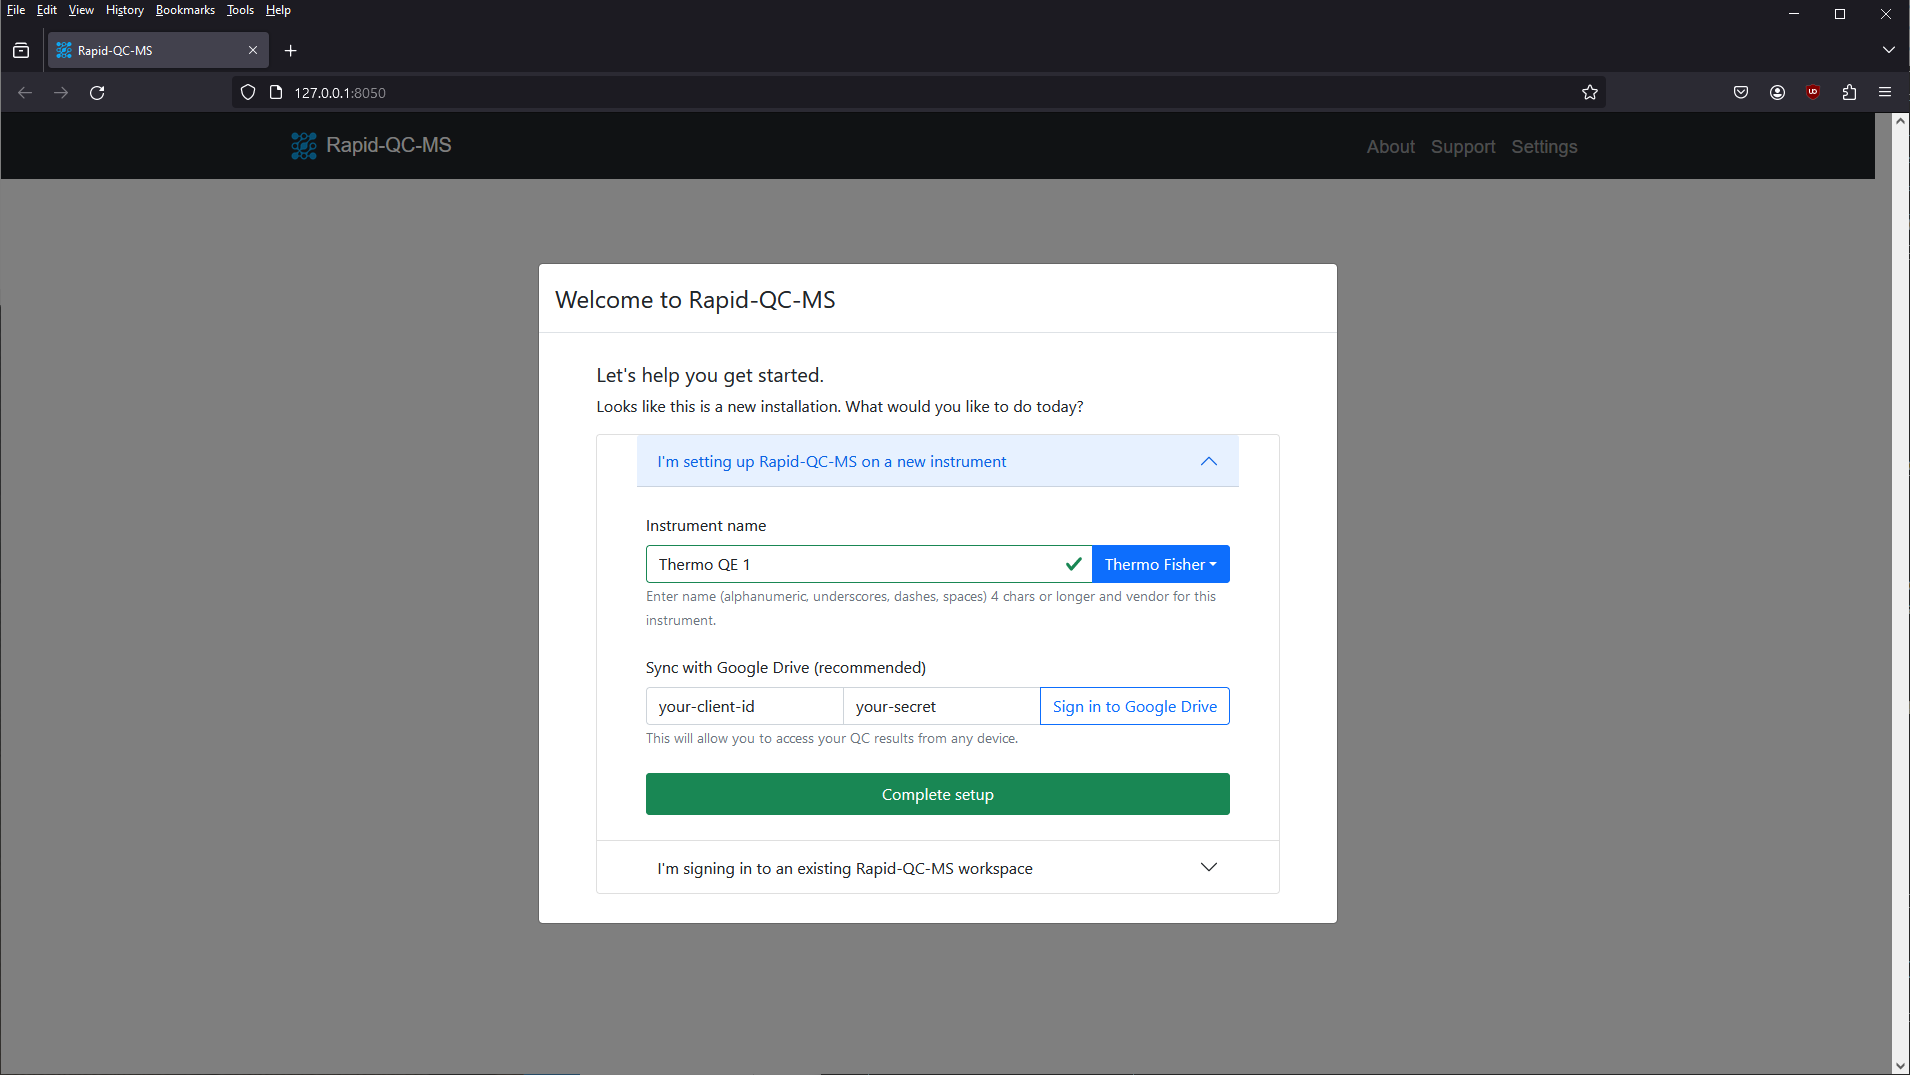
Google Drive sync
If the user opts to set up and enable Google Drive sync with their Google account, the Rapid-QC-MS workspace can be securely accessed from any device.
All data is stored and synced on the user’s Google Drive account, allowing instrument runs to be monitored from home and QC results to be accessed in realtime by all relevant stakeholders at the same time.
Highly configurable settings
Rapid-QC-MS was designed to be highly configurable for many use cases. As such, the user has complete authority on configuring workspace access, chromatography methods, biological standards, RapidQC parameters, and MS-DIAL processing parameters.
If you’ve already installed Rapid-QC-MS and its dependencies, you can check out the Quickstart guide to learn how to make Rapid-QC-MS work best for you.
Workspace
In Settings > General, the user is able to:
- Enable Google Drive cloud sync
- Manage workspace access among users
- Register a Slack bot for Slack notifications
- Register addresses for email notifications
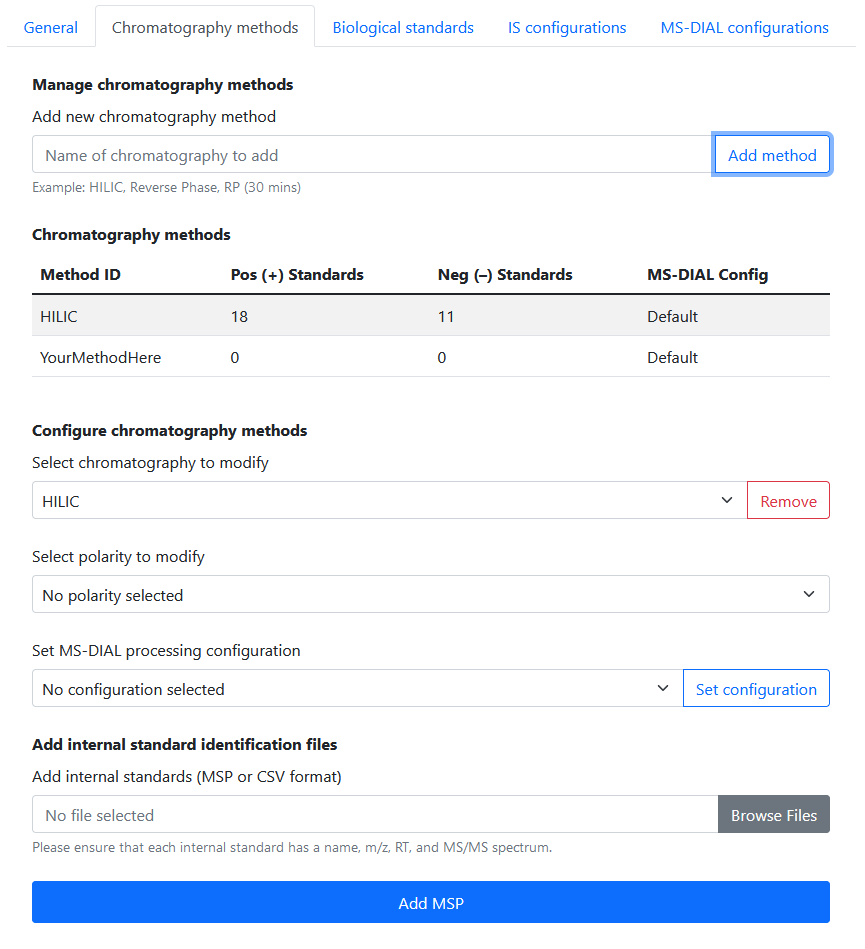
Internal standards
In Settings > Chromatography Methods, the user is able to:
- Add / delete chromatography methods
- Add internal standard libraries for each chromatography–polarity combination
- Set a custom processing configuration for each chromatography method
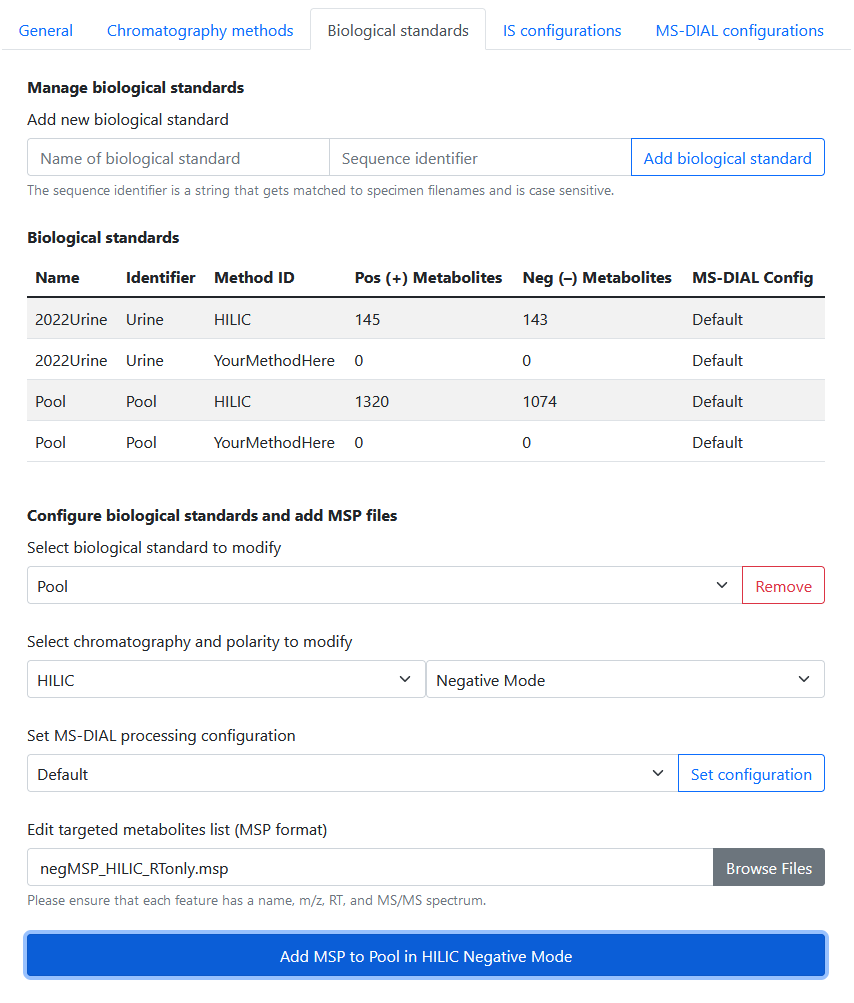
Biological standards
In Settings > Biological Standards, the user is able to:
- Add / delete biological standards with sequence identifiers
- Add spectral libraries for each features to be monitored in biological standard workflow(s)
- Set custom processing configuration for each biological standard–chromatography combination
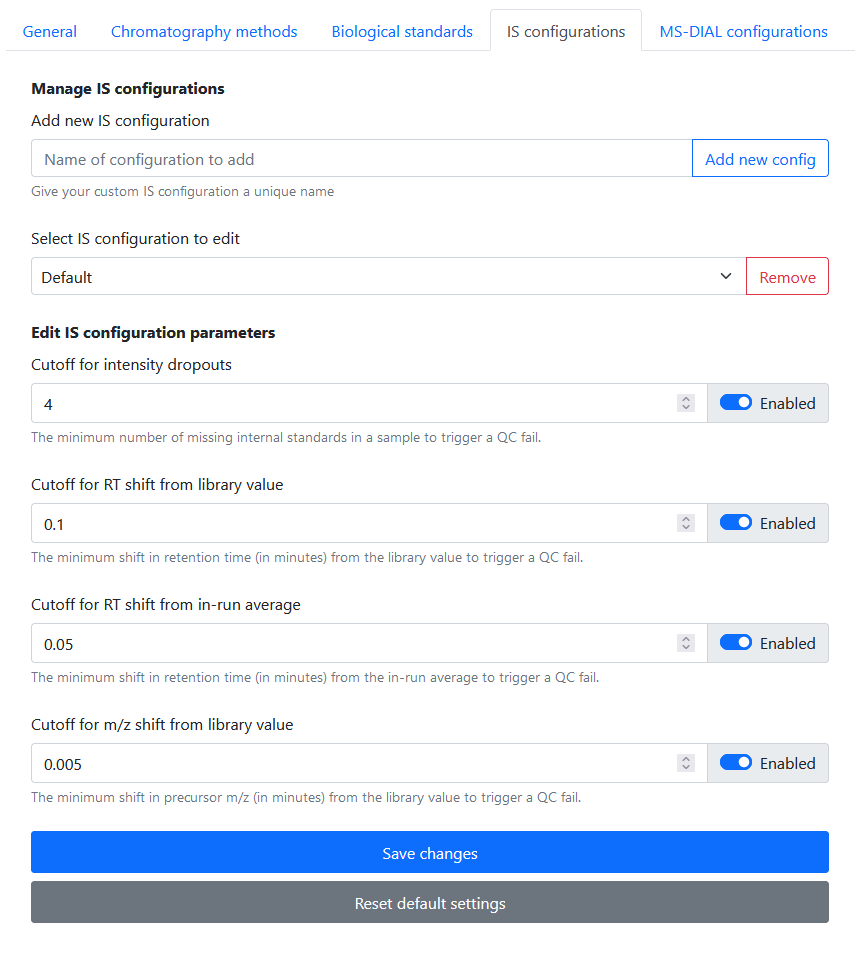
IS configurations
In Settings > IS Configurations, the user is able to:
- Add / delete IS configurations
- Set cutoff for intensity dropouts
- Set cutoff for RT shift from library value
- Set cutoff for RT shift from in-run average
- Set cutoff for m/z drift from library value
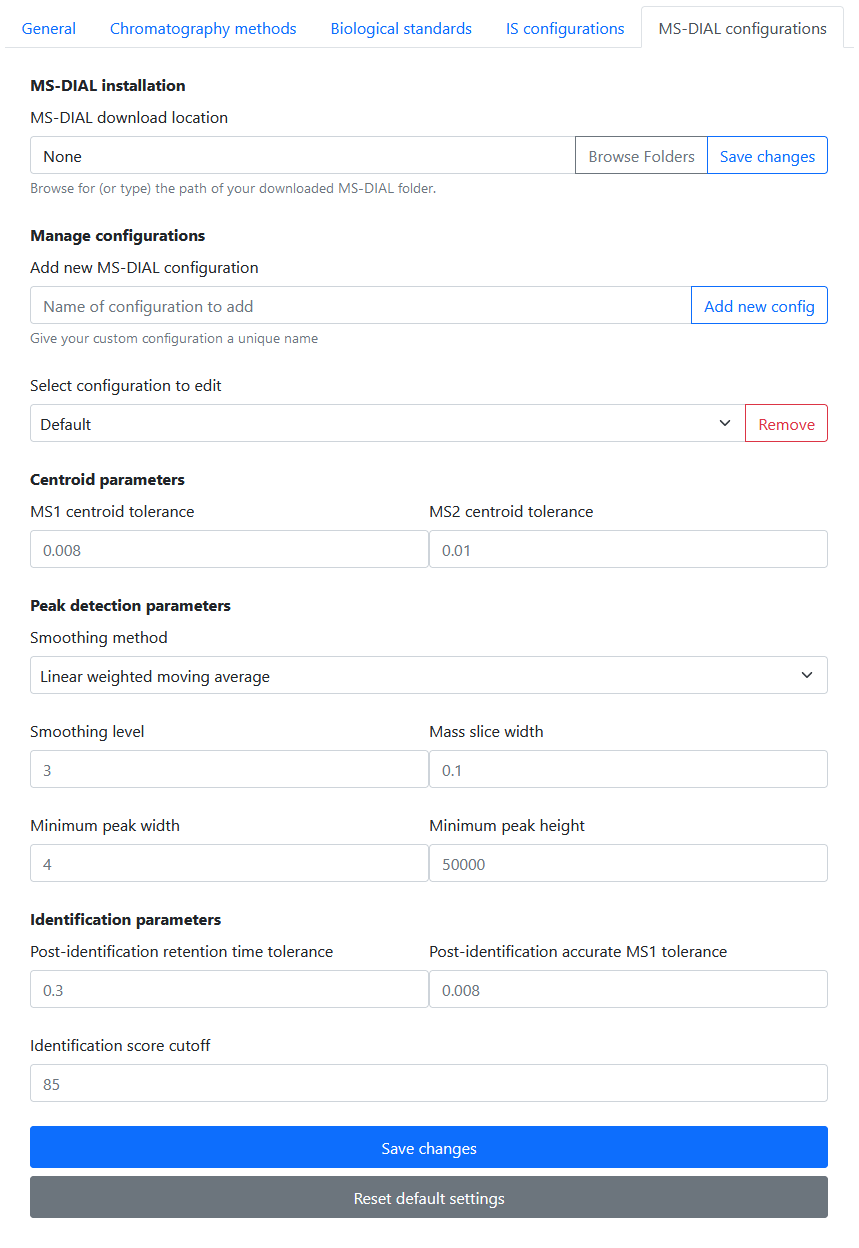
MS-DIAL configurations
In Settings > MS-DIAL Configurations, the user is able to:
- Add / delete MS-DIAL configurations
- Set data collection parameters
- Set centroid parameters
- Set peak detection parameters
- Set identification parameters
- Set alignment parameters