Dataset integration#
In this tutorial, we will integrate a differential centrifugation (DC) dataset with an organellar immunoprecipitation (OrgIP) dataset.
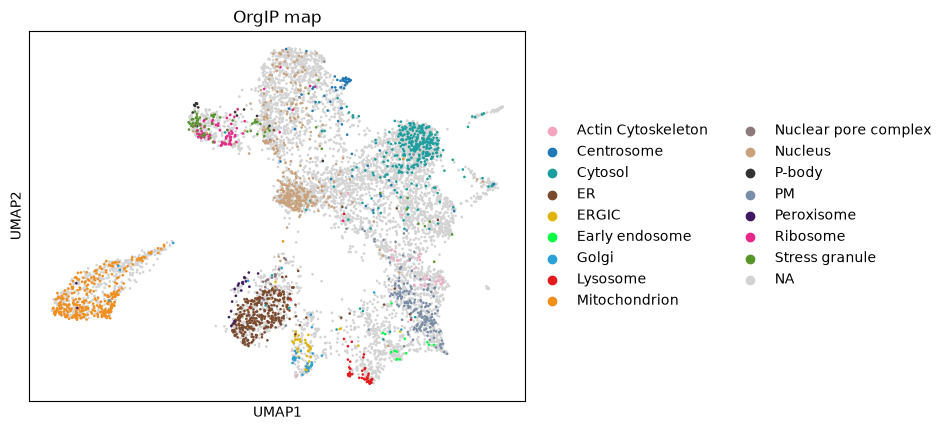
While DC is a more scalable technique, OrgIP provides significantly higher resolution. A practical approach to achieving high-resolution mapping is to strategically supplement DC data with targeted IP pulldowns for cellular compartments that are poorly resolved by centrifugation alone.
Although we merge two complete datasets in this example, real-world applications typically involve combining a DC dataset with only a small number of strategic IPs.
This integration process is streamlined using the grassp package.
If you have not installed grassp yet, please follow the installation instructions.
import grassp as gr
import scanpy as sc
import anndata as ad
import numpy as np
Loading Data#
# load DC dataset (hek cells)
dc = gr.ds.load_dataset("Frank_2026_HEK293")
dc
/opt/hostedtoolcache/Python/3.12.16/x64/lib/python3.12/site-packages/tqdm/auto.py:21: TqdmWarning: IProgress not found. Please update jupyter and ipywidgets. See https://ipywidgets.readthedocs.io/en/stable/user_install.html
  from .autonotebook import tqdm as notebook_tqdm
0%| | 0.00/22.4M [00:00<?, ?B/s]
0%| | 40.0k/22.4M [00:00<01:08, 343kB/s]
1%| | 168k/22.4M [00:00<00:27, 855kB/s]
3%|▎ | 744k/22.4M [00:00<00:08, 2.79MB/s]
12%|█▏ | 2.62M/22.4M [00:00<00:02, 8.34MB/s]
41%|████ | 9.13M/22.4M [00:00<00:00, 24.6MB/s]
75%|███████▍ | 16.8M/22.4M [00:00<00:00, 37.8MB/s]
100%|██████████| 22.4M/22.4M [00:00<00:00, 29.5MB/s]
AnnData object with n_obs × n_vars = 8595 × 7
    obs: 'protein_name', 'gene_symbol', 'Protein IDs', 'Peptide counts (all)', 'Peptide counts (razor+unique)', 'Peptide counts (unique)', 'Protein names', 'Gene names', 'Number of proteins', 'Peptides', 'Razor + unique peptides', 'Unique peptides', 'Sequence coverage [%]', 'Unique + razor sequence coverage [%]', 'Unique sequence coverage [%]', 'Mol. weight [kDa]', 'Sequence length', 'Sequence lengths', 'Fraction average', 'Fraction 1', 'Fraction 2', 'Fraction 3', 'Q-value', 'Score', 'Intensity', 'iBAQ', 'MS/MS count', 'id', 'Peptide IDs', 'Peptide is razor', 'Mod. peptide IDs', 'Oxidation (M) site IDs', 'Oxidation (M) site positions', 'Reviewed', 'Length', 'Gene Names (primary)', 'Annotation', 'marker_lilley', 'marker_christopher', 'marker_geladaki', 'marker_itzhak', 'marker_villaneuva', 'marker_hein2025', 'marker_hein2025_gt', 'n_samples_by_intensity', 'mean_intensity', 'log1p_mean_intensity', 'pct_dropout_by_intensity', 'total_intensity', 'log1p_total_intensity', 'n_imputed', 'leiden_0.5', 'leiden_0.8', 'leiden_1.0', 'leiden_2.0', 'leiden_3.0', 'leiden_5.0', 'leiden_8.0', 'leiden_12.0', 'leiden_15.0', 'leiden_15.0_CC_enrichment_consolidated', 'leiden_15.0_CC_enrichment_consolidated_Adjusted P-value Bonferroni', 'logEnrichmentPval', 'leiden_15.0_CC_enrichment_consolidated_filtered0.05', 'leiden_15.0_CC_enrichment_consolidated_filtered0.01', 'leiden_15.0_CC_enrichment_consolidated_filtered0.001', 'leiden_3.0_CC_enrichment', 'leiden_3.0_CC_enrichment_Adjusted P-value Bonferroni', 'leiden_15.0_CC_enrichment', 'leiden_15.0_CC_enrichment_Adjusted P-value Bonferroni', 'Topological domain', 'Transmembrane', 'Intramembrane', 'has_signal', 'has_transmem', 'has_intramem', 'has_topo_dom', 'mitocarta', 'mitocarta_evidence', 'mitocarta_subloc', 'mitocop', 'author_annotation', 'author_markers', 'unsupervised_annotation', 'harmonized_annotation_propagated', 'harmonized_annotation_propagated_probability', 'diff_uniprot_maxp', 'diff_uniprot_resolved', 'diff_uniprot_resolved_label_compact', 'diff_uniprot_fine_maxp', 'diff_uniprot_fine_resolved', 'diff_uniprot_fine_resolved_label_compact', 'diff_gocc_maxp', 'diff_gocc_resolved', 'diff_gocc_resolved_label_compact', 'diff_compartments_maxp', 'diff_compartments_resolved', 'diff_compartments_resolved_label_compact'
    var: 'development_stage', 'tissue', 'sex', 'organism', 'disease', 'cell_line', 'cell_type', 'subcellular_enrichment', 'n_merged_samples', 'mean', 'std', 'enrichment_strategy', 'mass_spectrometry_method', 'cell_type_ontology_term_id', 'perturbation', 'disease_ontology_term_id', 'organism_ontology_term_id', 'sex_ontology_term_id', 'development_stage_ontology_term_id', 'tissue_ontology_term_id', 'cell_line_ontology_term_id', 'tissue_type', 'tissue_general_ontology_term_id', 'tissue_general', 'organ_ontology_term_id', 'organ', 'system_ontology_term_id', 'system'
    uns: 'RawInfo', 'diff_compartments_alpha', 'diff_compartments_categories', 'diff_gocc_alpha', 'diff_gocc_categories', 'diff_uniprot_alpha', 'diff_uniprot_categories', 'diff_uniprot_fine_alpha', 'diff_uniprot_fine_categories', 'diff_uniprot_fine_resolved_colors', 'diff_uniprot_resolved_colors', 'harmonized_annotation_propagated_colors', 'has_intramem_colors', 'has_signal_colors', 'has_topo_dom_colors', 'has_transmem_colors', 'leiden_0.5', 'leiden_0.5_colors', 'leiden_0.8', 'leiden_0.8_colors', 'leiden_1.0', 'leiden_1.0_colors', 'leiden_12.0', 'leiden_12.0_colors', 'leiden_15.0', 'leiden_15.0_CC_enrichment_colors', 'leiden_15.0_CC_enrichment_consolidated_colors', 'leiden_15.0_CC_enrichment_consolidated_filtered0.001_colors', 'leiden_15.0_CC_enrichment_consolidated_filtered0.01_colors', 'leiden_15.0_CC_enrichment_consolidated_filtered0.05_colors', 'leiden_15.0_colors', 'leiden_2.0', 'leiden_2.0_colors', 'leiden_3.0', 'leiden_3.0_CC_enrichment_colors', 'leiden_3.0_colors', 'leiden_5.0', 'leiden_5.0_colors', 'leiden_8.0', 'leiden_8.0_colors', 'marker_christopher_colors', 'marker_geladaki_colors', 'marker_hein2025_colors', 'marker_hein2025_gt_colors', 'marker_itzhak_colors', 'marker_lilley_colors', 'marker_villaneuva_colors', 'mitocarta_colors', 'mitocop_colors', 'neighbors', 'pca', 'publication_authors', 'publication_date', 'publication_doi', 'publication_journal', 'publication_title', 'schema_reference', 'schema_version', 'serves_as_reference', 'title', 'umap', 'unsupervised_annotation_colors'
    obsm: 'X_pca', 'X_umap', 'X_umap3D', 'harmonized_annotation_propagated_one_hot_labels', 'harmonized_annotation_propagated_probabilities'
    varm: 'PCs'
    obsp: 'connectivities', 'distances'
    layers: 'MS_MS count', 'log_intensities', 'original_intensities', 'pvals', 'raw_intensities', None (.X)
# OrgIP dataset (hek cells)
orgip = gr.ds.load_dataset("Hein_2025_HEK293_WT")
# This object ships the untagged (WT) control pulldowns and unscaled log fold
# changes. Drop the controls and z-score each bait, so that the ~70 IP columns
# and the 7 DC fractions contribute on a comparable scale when we concatenate.
orgip = orgip[:, ~orgip.var_names.str.endswith("-WT")].copy()
sc.pp.scale(orgip)
orgip
0%| | 0.00/22.9M [00:00<?, ?B/s]
0%| | 40.0k/22.9M [00:00<01:10, 342kB/s]
1%| | 184k/22.9M [00:00<00:27, 859kB/s]
3%|▎ | 760k/22.9M [00:00<00:08, 2.70MB/s]
13%|█▎ | 2.99M/22.9M [00:00<00:02, 9.33MB/s]
43%|████▎ | 9.87M/22.9M [00:00<00:00, 27.3MB/s]
77%|███████▋ | 17.6M/22.9M [00:00<00:00, 40.1MB/s]
100%|██████████| 22.9M/22.9M [00:00<00:00, 30.0MB/s]
AnnData object with n_obs × n_vars = 8450 × 71
    obs: 'protein_name', 'gene_symbol', 'Protein IDs', 'author_gene_symbol', 'Majority protein IDs', 'Gene names', 'Gene_name_canonical', 'author_annotation', 'author_markers', 'marker_lilley', 'marker_christopher', 'marker_geladaki', 'marker_itzhak', 'marker_villaneuva', 'marker_hein2025', 'marker_hein2025_gt', 'n_samples_by_intensity', 'mean_intensity', 'pct_dropout_by_intensity', 'total_intensity', 'unsupervised_annotation', 'harmonized_annotation_propagated', 'harmonized_annotation_propagated_probability', 'diff_uniprot_maxp', 'diff_uniprot_resolved', 'diff_uniprot_resolved_label_compact', 'diff_uniprot_fine_maxp', 'diff_uniprot_fine_resolved', 'diff_uniprot_fine_resolved_label_compact', 'diff_gocc_maxp', 'diff_gocc_resolved', 'diff_gocc_resolved_label_compact', 'diff_compartments_maxp', 'diff_compartments_resolved', 'diff_compartments_resolved_label_compact'
    var: 'development_stage', 'tissue', 'sex', 'organism', 'disease', 'cell_line', 'cell_type', 'subcellular_enrichment', 'fraction', 'fraction_order', 'biological_replicate', 'n_proteins_by_intensity', 'total_intensity', 'pct_dropout_by_intensity', 'enrichment_strategy', 'mass_spectrometry_method', 'cell_type_ontology_term_id', 'perturbation', 'disease_ontology_term_id', 'organism_ontology_term_id', 'sex_ontology_term_id', 'development_stage_ontology_term_id', 'tissue_ontology_term_id', 'cell_line_ontology_term_id', 'tissue_type', 'tissue_general_ontology_term_id', 'tissue_general', 'organ_ontology_term_id', 'organ', 'system_ontology_term_id', 'system', 'mean', 'std'
    uns: 'author_annotation_colors', 'author_markers_colors', 'diff_compartments_alpha', 'diff_compartments_categories', 'diff_gocc_alpha', 'diff_gocc_categories', 'diff_uniprot_alpha', 'diff_uniprot_categories', 'diff_uniprot_fine_alpha', 'diff_uniprot_fine_categories', 'diff_uniprot_fine_resolved_colors', 'diff_uniprot_resolved_colors', 'harmonized_annotation_propagated_colors', 'marker_christopher_colors', 'marker_geladaki_colors', 'marker_hein2025_colors', 'marker_hein2025_gt_colors', 'marker_itzhak_colors', 'marker_lilley_colors', 'marker_villaneuva_colors', 'neighbors', 'publication_authors', 'publication_date', 'publication_doi', 'publication_journal', 'publication_title', 'schema_reference', 'schema_version', 'serves_as_reference', 'title', 'unsupervised_annotation_colors'
    obsm: 'X_pca', 'X_umap', 'X_umap3D', 'harmonized_annotation_propagated_one_hot_labels', 'harmonized_annotation_propagated_probabilities'
    obsp: 'connectivities', 'distances'
    layers: 'pvals', None (.X)
Plotting individual maps#
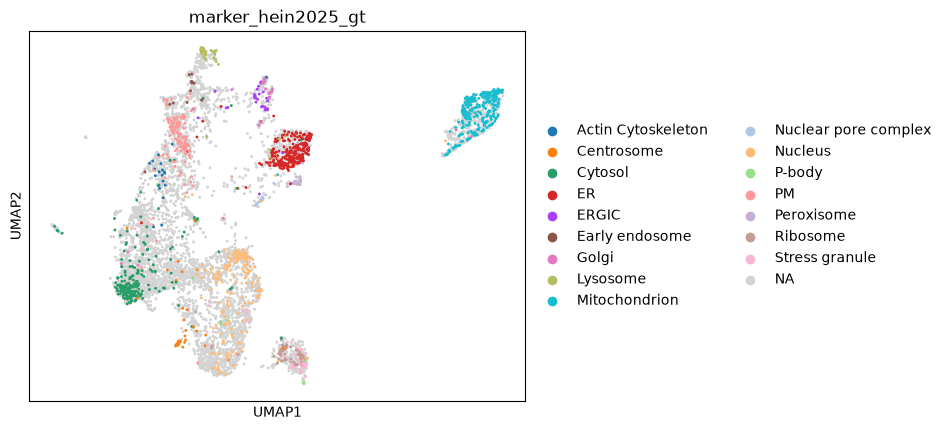
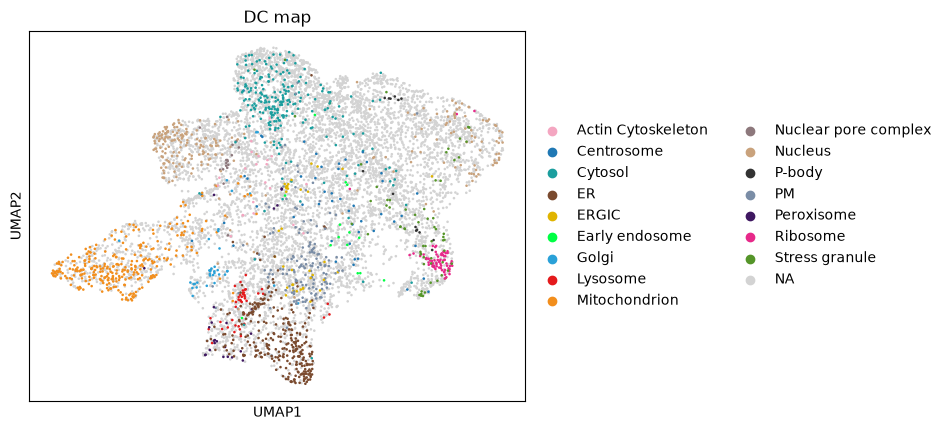
Next, we use UMAP to visualize the spatial organization of the datasets. This helps us qualitatively assess how well the biological compartments are resolved before proceeding with downstream integration or analysis.
Note that we can plot right away, without calling sc.pp.neighbors and sc.tl.umap first: datasets from the grassp portal ship with a precomputed embedding in .obsm["X_umap"], and that is what sc.pl.umap draws. Those coordinates were computed for the full published map, so dropping the untagged controls and z-scoring the OrgIP object above does not change them. For the integrated object further down — and for your own data — we have to compute the embedding ourselves first.
sc.pl.umap(dc, color="marker_hein2025_gt", title="DC map")
sc.pl.umap(orgip, color="marker_hein2025_gt", title="OrgIP map")
Integration#
To integrate the two datasets, we must identify a common gene or protein identifier to facilitate matching. While UniProt IDs or gene names are typical candidates, direct merging via UniProt IDs is challenging in this case because one dataset was searched against Swiss-Prot and the other against TrEMBL. To ensure consistency, we will first collapse all entries based on their gene names.
# aggregate proteins in the DC dataset
dc = dc[dc.obs["Gene names"].notna()]
dc_agg = gr.pp.aggregate_proteins(dc, grouping_columns="Gene names", agg_func=np.mean)
dc_agg.obs.head()
| protein_name | gene_symbol | Protein IDs | Peptide counts (all) | Peptide counts (razor+unique) | Peptide counts (unique) | Protein names | Gene names | Number of proteins | Peptides | ... | diff_uniprot_fine_maxp | diff_uniprot_fine_resolved | diff_uniprot_fine_resolved_label_compact | diff_gocc_maxp | diff_gocc_resolved | diff_gocc_resolved_label_compact | diff_compartments_maxp | diff_compartments_resolved | diff_compartments_resolved_label_compact | n_merged_proteins | |
|---|---|---|---|---|---|---|---|---|---|---|---|---|---|---|---|---|---|---|---|---|---|
| AAAS | Aladin (Adracalin) | AAAS | Q9NRG9;Q9NRG9-2 | 24;20 | 24;20 | 24;20 | Aladin | AAAS | 2.0 | 24.0 | ... | 0.512248 | NaN | Nucleus | 0.499026 | NaN | NaN | 0.550837 | NaN | NUCLEUS | 1 |
| AACS | Acetoacetyl-CoA synthetase (EC 6.2.1.16) (Acyl... | AACS | Q86V21;Q86V21-2;Q86V21-3 | 28;21;15 | 28;21;15 | 28;21;15 | Acetoacetyl-CoA synthetase | AACS | 3.0 | 28.0 | ... | 0.706381 | Cytoplasm | Cytoplasm | 0.835645 | cytosol (GO:0005829) | cytosol (GO:0005829) | 0.707687 | CYTOSOL | CYTOSOL | 1 |
| AADAT | Kynurenine/alpha-aminoadipate aminotransferase... | AADAT | Q8N5Z0;Q8N5Z0-2 | 9;8 | 9;8 | 9;8 | Kynurenine/alpha-aminoadipate aminotransferase... | AADAT | 2.0 | 9.0 | ... | 0.509825 | NaN | Mitochondrion | 0.580080 | NaN | mitochondrion (GO:0005739) | 0.529311 | NaN | MITOCHONDRION | 1 |
| AAED1 | Peroxiredoxin-like 2C (AhpC/TSA antioxidant en... | PRXL2C | Q7RTV5 | 4 | 4 | 4 | Thioredoxin-like protein AAED1 | AAED1 | 1.0 | 4.0 | ... | 0.523349 | NaN | Cytoplasm | 0.555368 | plasma membrane (GO:0005886) | plasma membrane (GO:0005886)/cytosol (GO:0005829) | 0.484393 | NaN | NaN | 1 |
| AAGAB | Alpha- and gamma-adaptin-binding protein p34 | AAGAB | Q6PD74;Q6PD74-2 | 10;6 | 10;6 | 10;6 | Alpha- and gamma-adaptin-binding protein p34 | AAGAB | 2.0 | 10.0 | ... | 0.791905 | Cytoplasm | Cytoplasm | 0.743661 | cytosol (GO:0005829) | nucleus (GO:0005634)/cytosol (GO:0005829) | 0.728387 | CYTOSOL | NUCLEUS/CYTOSOL | 1 |
5 rows × 99 columns
# aggregate proteins in the OrgIP dataset
orgip_agg = gr.pp.aggregate_proteins(
    orgip, grouping_columns="Gene_name_canonical", agg_func=np.mean
)
orgip_agg.obs_names = orgip_agg.obs_names.str.upper()
orgip_agg.obs.head()
| protein_name | gene_symbol | Protein IDs | author_gene_symbol | Majority protein IDs | Gene names | Gene_name_canonical | author_annotation | author_markers | marker_lilley | ... | diff_uniprot_fine_maxp | diff_uniprot_fine_resolved | diff_uniprot_fine_resolved_label_compact | diff_gocc_maxp | diff_gocc_resolved | diff_gocc_resolved_label_compact | diff_compartments_maxp | diff_compartments_resolved | diff_compartments_resolved_label_compact | n_merged_proteins | |
|---|---|---|---|---|---|---|---|---|---|---|---|---|---|---|---|---|---|---|---|---|---|
| A0A2R8Y3M9[P] | Group XIIA secretory phospholipase A2 (EC 3.1.... | NaN | A0A2R8Y3M9 | A0A2R8Y3M9[p] | A0A2R8Y3M9 | NaN | A0A2R8Y3M9[p] | unclassified | NaN | NaN | ... | 0.575301 | Nucleus | Nucleus | 0.612056 | cytosol (GO:0005829) | nucleus (GO:0005634)/nuclear lumen (GO:0031981... | 0.632372 | NUCLEUS | NUCLEUS | 1 |
| A0A3B3ITR4[P] | Krev interaction trapped protein 1 (Leucine-ri... | NaN | A0A3B3ITR4;A0A0C4DG23;C9J718;C9JF32;C9JBN7;C9J... | A0A3B3ITR4[p] | A0A3B3ITR4 | NaN | A0A3B3ITR4[p] | recycling_endosome | NaN | NaN | ... | 0.357786 | NaN | NaN | 0.469233 | NaN | NaN | 0.458584 | NaN | NaN | 1 |
| A0A5C2GRJ2[P] | IG c1334_heavy_IGHV3-73_IGHD6-6_IGHJ4 | NaN | A0A5C2GRJ2 | A0A5C2GRJ2[p] | A0A5C2GRJ2 | NaN | A0A5C2GRJ2[p] | unclassified | NaN | NaN | ... | 0.664616 | Cytoplasm | Cytoplasm/Nucleus | 0.699691 | nucleus (GO:0005634) | nucleus (GO:0005634)/nuclear lumen (GO:0031981) | 0.677039 | NUCLEUS | NUCLEUS | 1 |
| A0A384MDX9[P] | Far upstream element-binding protein 1 | NaN | B4E0X8;A0A384MDX9 | A0A384MDX9[p];B4E0X8[p] | B4E0X8;A0A384MDX9 | NaN | A0A384MDX9[p] | nucleus | NaN | NaN | ... | 0.877858 | Nucleus | Cytoplasm/Nucleus | 0.852083 | nucleus (GO:0005634) | nucleus (GO:0005634)/nuclear lumen (GO:0031981... | 0.813083 | NUCLEUS | NUCLEUS/NUCLEOPLASM | 1 |
| A4UCU2[P] | Beta-4 tubulin | NaN | A4UCU2 | A4UCU2[p] | A4UCU2 | NaN | A4UCU2[p] | cytosol | NaN | NaN | ... | 0.551413 | NaN | Cytoplasm | 0.425579 | NaN | NaN | 0.398423 | NaN | NaN | 1 |
5 rows × 36 columns
# combine the two datasets, keep only the common proteins,
combined = ad.concat(
    [dc_agg, orgip_agg],
    axis=1,  # This specifies a horizontal concatenation. We are keeping the proteins as rows and concatenating the experimental fractions or pulldowns from both datasets as columns.
    join="inner",
    merge="first",
    keys=["dc", "orgip"],
    label="dataset",
)
combined
AnnData object with n_obs × n_vars = 6990 × 78
    obs: 'protein_name', 'gene_symbol', 'Protein IDs', 'Peptide counts (all)', 'Peptide counts (razor+unique)', 'Peptide counts (unique)', 'Protein names', 'Gene names', 'Number of proteins', 'Peptides', 'Razor + unique peptides', 'Unique peptides', 'Sequence coverage [%]', 'Unique + razor sequence coverage [%]', 'Unique sequence coverage [%]', 'Mol. weight [kDa]', 'Sequence length', 'Sequence lengths', 'Fraction average', 'Fraction 1', 'Fraction 2', 'Fraction 3', 'Q-value', 'Score', 'Intensity', 'iBAQ', 'MS/MS count', 'id', 'Peptide IDs', 'Peptide is razor', 'Mod. peptide IDs', 'Oxidation (M) site IDs', 'Oxidation (M) site positions', 'Reviewed', 'Length', 'Gene Names (primary)', 'Annotation', 'marker_lilley', 'marker_christopher', 'marker_geladaki', 'marker_itzhak', 'marker_villaneuva', 'marker_hein2025', 'marker_hein2025_gt', 'n_samples_by_intensity', 'mean_intensity', 'log1p_mean_intensity', 'pct_dropout_by_intensity', 'total_intensity', 'log1p_total_intensity', 'n_imputed', 'leiden_0.5', 'leiden_0.8', 'leiden_1.0', 'leiden_2.0', 'leiden_3.0', 'leiden_5.0', 'leiden_8.0', 'leiden_12.0', 'leiden_15.0', 'leiden_15.0_CC_enrichment_consolidated', 'leiden_15.0_CC_enrichment_consolidated_Adjusted P-value Bonferroni', 'logEnrichmentPval', 'leiden_15.0_CC_enrichment_consolidated_filtered0.05', 'leiden_15.0_CC_enrichment_consolidated_filtered0.01', 'leiden_15.0_CC_enrichment_consolidated_filtered0.001', 'leiden_3.0_CC_enrichment', 'leiden_3.0_CC_enrichment_Adjusted P-value Bonferroni', 'leiden_15.0_CC_enrichment', 'leiden_15.0_CC_enrichment_Adjusted P-value Bonferroni', 'Topological domain', 'Transmembrane', 'Intramembrane', 'has_signal', 'has_transmem', 'has_intramem', 'has_topo_dom', 'mitocarta', 'mitocarta_evidence', 'mitocarta_subloc', 'mitocop', 'author_annotation', 'author_markers', 'unsupervised_annotation', 'harmonized_annotation_propagated', 'harmonized_annotation_propagated_probability', 'diff_uniprot_maxp', 'diff_uniprot_resolved', 'diff_uniprot_resolved_label_compact', 'diff_uniprot_fine_maxp', 'diff_uniprot_fine_resolved', 'diff_uniprot_fine_resolved_label_compact', 'diff_gocc_maxp', 'diff_gocc_resolved', 'diff_gocc_resolved_label_compact', 'diff_compartments_maxp', 'diff_compartments_resolved', 'diff_compartments_resolved_label_compact', 'n_merged_proteins', 'author_gene_symbol', 'Majority protein IDs', 'Gene_name_canonical'
    var: 'development_stage', 'tissue', 'sex', 'organism', 'disease', 'cell_line', 'cell_type', 'subcellular_enrichment', 'mean', 'std', 'enrichment_strategy', 'mass_spectrometry_method', 'cell_type_ontology_term_id', 'perturbation', 'disease_ontology_term_id', 'organism_ontology_term_id', 'sex_ontology_term_id', 'development_stage_ontology_term_id', 'tissue_ontology_term_id', 'cell_line_ontology_term_id', 'tissue_type', 'tissue_general_ontology_term_id', 'tissue_general', 'organ_ontology_term_id', 'organ', 'system_ontology_term_id', 'system', 'dataset'
    layers: 'pvals', None (.X)
# compute UMAP embeddings
sc.pp.neighbors(combined, use_rep="X")
sc.tl.umap(combined, min_dist=0.1)
# plot UMAP of the integrated dataset
sc.pl.umap(combined, color="marker_hein2025_gt")